Reliability problems
The structural reliability benchmarking framework is an on-line documentation platform that contains all kind of reliability problems with their descriptions, implementation files, and visualization of the performance functions. By making this information publicly available, it is intended to stimulate a systematic and reproducible assessment of the accuracy and efficiency of currently available reliability methods and those to come in the future. Furthermore, the platform is envisaged as a dynamic environment in which you are encouraged to contribute and add new, interesting problems.
Note
For most problems the failure probabilities are calculated with numerical methods that converge to the exact solution. Due to the applied stopping criteria of these numerical methods you may attain slightly different results. The difference should be a small difference in the second decimal of the normal form (scientific notation) representation of the failure probability. The reliability index (\(\beta\)) is calculated from the failure probability (\(P_\mathrm{f}\)) the following way: \(\beta=-\Phi^{-1}(P_\mathrm{f})\).
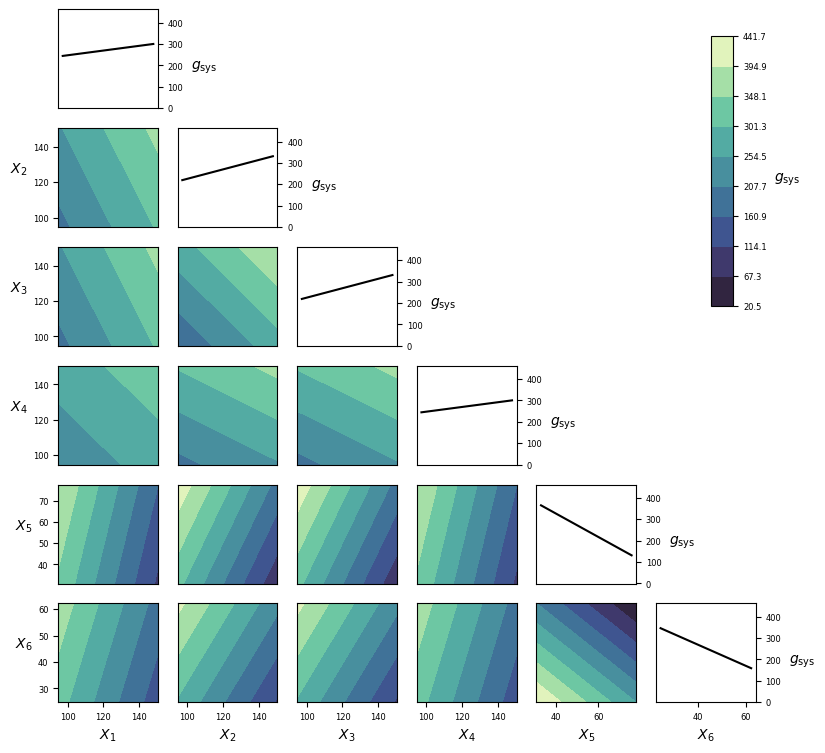
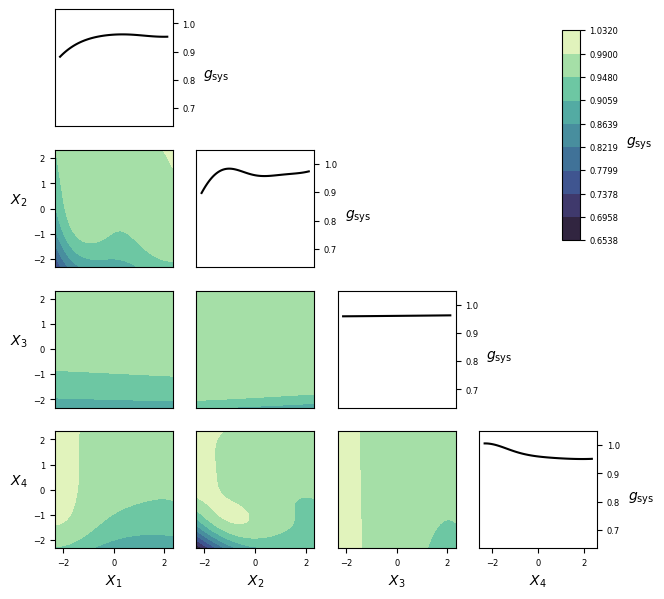
RP8
Six-dimensional hyperplane.
set_id |
problem_id |
|---|---|
| -1 | 1 |
Overview
| Category | Value |
|---|---|
| Type | symbolic |
| Number of random variables | 6 |
| Failure probability, \(P_\mathrm{f}\) | \(7.84\cdot10^{-4}\) |
| Reliability index, \(\beta=-\Phi^{-1}(P_\mathrm{f})\) | 3.16 |
| Number of performance functions | 1 |
| Reference | [Xu2018] |
Performance function
Random variables
The parametrization of distributions follows that of in Distributions.
| Variable | Description | Distribution | \(\theta_1\) | \(\theta_2\) | \(\theta_3\) | \(\theta_4\) | Mean | Std |
|---|---|---|---|---|---|---|---|---|
| \(X_1\) | NA | Lognormal | 4.783 | 0.09975 | 120.0 | 12.0 | ||
| \(X_2\) | NA | Lognormal | 4.783 | 0.09975 | 120.0 | 12.0 | ||
| \(X_3\) | NA | Lognormal | 4.783 | 0.09975 | 120.0 | 12.0 | ||
| \(X_4\) | NA | Lognormal | 4.783 | 0.09975 | 120.0 | 12.0 | ||
| \(X_5\) | NA | Lognormal | 3.892 | 0.198 | 50.0 | 10.0 | ||
| \(X_6\) | NA | Lognormal | 3.669 | 0.198 | 40.0 | 8.0 |
The random variables are mutually independent.
Visualization
Implementation
Python
-
gfun_8(x)[source]¶ Performance function for reliability problem 8.
Parameters: x (numpy.array of float(s)) – Values of independent variables: columns are the different parameters/random variables (x1, x2,…xn) and rows are different parameter/random variables sets for different calls. Returns: - g_val_sys (numpy.array of float(s)) – Performance function value for the system.
- g_val_comp (numpy.array of float(s)) – Performance function value for each component.
- msg (str) – Accompanying diagnostic message, e.g. warning.
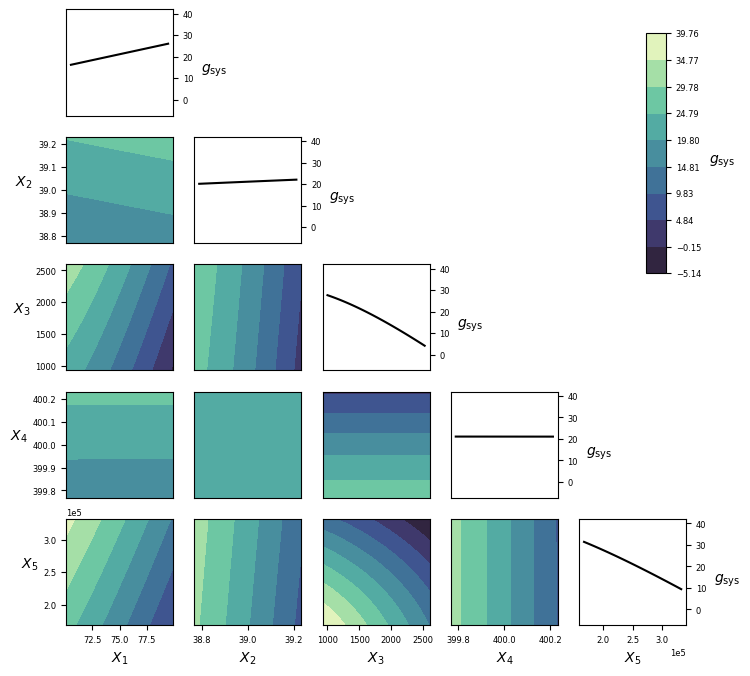
RP14
set_id |
problem_id |
|---|---|
| 1 | 1 |
Overview
| Category | Value |
|---|---|
| Type | Symbolic |
| Number of random variables | 5 |
| Failure probability, \(P_\mathrm{f}\) | \(7.52\cdot10^{-3}\) |
| Reliability index, \(\beta=-\Phi^{-1}(P_\mathrm{f})\) | 2.42 |
| Number of performance functions | 1 |
| Reference | [Li2018] |
Performance function
Random variables
The parametrization of distributions follows that of in Distributions.
| Variable | Description | Distribution | \(\theta_1\) | \(\theta_2\) | \(\theta_3\) | \(\theta_4\) | Mean | Std |
|---|---|---|---|---|---|---|---|---|
| \(X_1\) | NA | Uniform | 70.0 | 80.0 | 75.0 | 2.887 | ||
| \(X_2\) | NA | Normal | 39.0 | 0.1 | 39.0 | 0.1 | ||
| \(X_3\) | NA | Gumbel-max | 1342.0 | 272.9 | 1500.0 | 350.0 | ||
| \(X_4\) | NA | Normal | 400.0 | 0.1 | 400.0 | 0.1 | ||
| \(X_5\) | NA | Normal | 250000.0 | 35000.0 | 250000.0 | 35000.0 |
The random variables are mutually independent.
Visualization
Implementation
Python
-
gfun_14(x)[source]¶ Performance function for reliability problem 14.
Parameters: x (numpy.array of float(s)) – Values of independent variables: columns are the different parameters/random variables (x1, x2,…xn) and rows are different parameter/random variables sets for different calls. Returns: - g_val_sys (numpy.array of float(s)) – Performance function value for the system.
- g_val_comp (numpy.array of float(s)) – Performance function value for each component.
- msg (str) – Accompanying diagnostic message, e.g. warning.
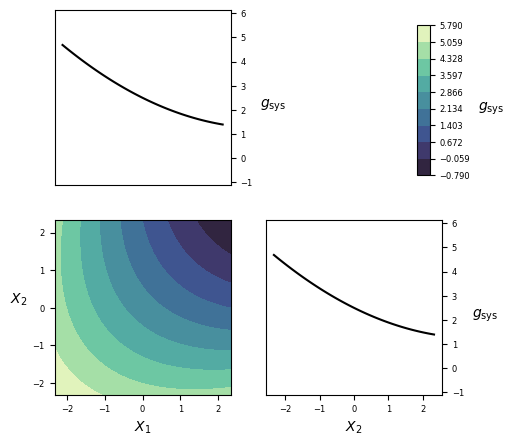
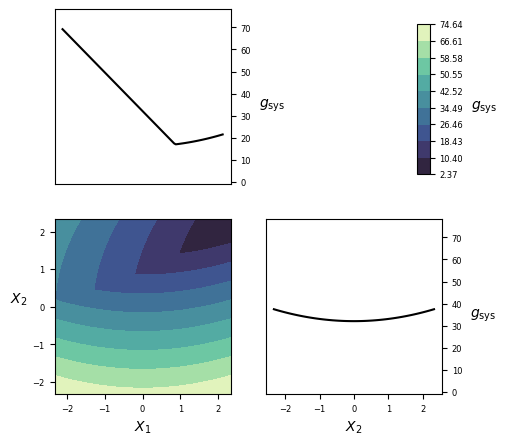
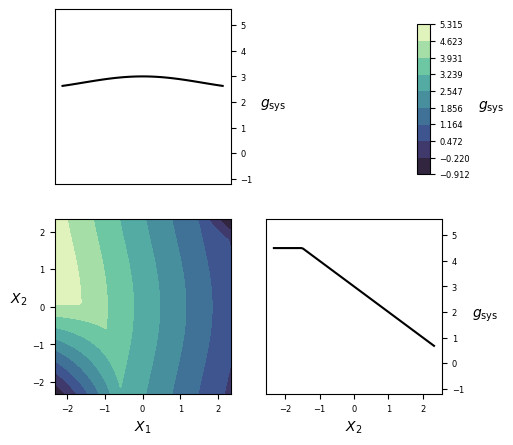
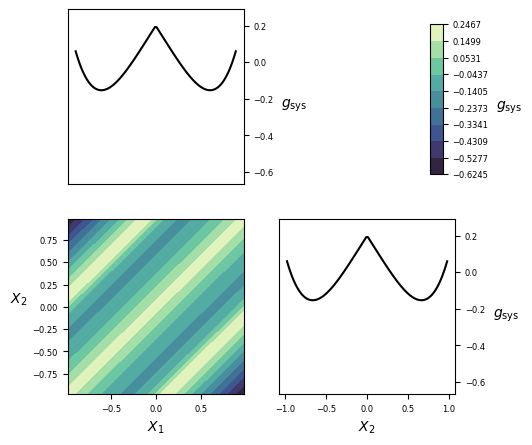
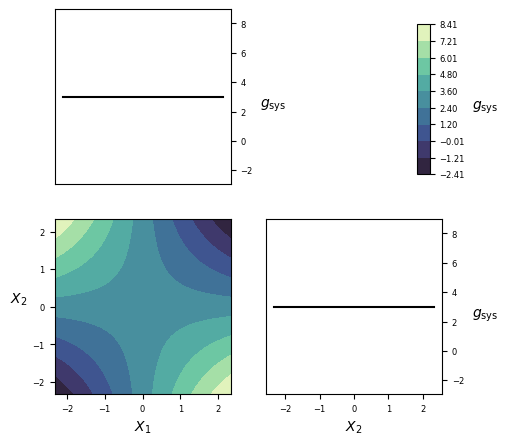
RP22
Quadratic function with mixed term, convex.
set_id |
problem_id |
|---|---|
| -1 | 2 |
Overview
| Category | Value |
|---|---|
| Type | symbolic |
| Number of random variables | 2 |
| Failure probability, \(P_\mathrm{f}\) | \(4.16\cdot10^{-3}\) |
| Reliability index, \(\beta=-\Phi^{-1}(P_\mathrm{f})\) | 2.64 |
| Number of performance functions | 1 |
| Reference | [Grooteman2011] |
Performance function
Random variables
The parametrization of distributions follows that of in Distributions.
| Variable | Description | Distribution | \(\theta_1\) | \(\theta_2\) | \(\theta_3\) | \(\theta_4\) | Mean | Std |
|---|---|---|---|---|---|---|---|---|
| \(X_1\) | NA | Normal | 0.0 | 1.0 | 0.0 | 1.0 | ||
| \(X_2\) | NA | Normal | 0.0 | 1.0 | 0.0 | 1.0 |
The random variables are mutually independent.
Visualization
Implementation
Python
-
gfun_22(x)[source]¶ Performance function for reliability problem 22.
Parameters: x (numpy.array of float(s)) – Values of independent variables: columns are the different parameters/random variables (x1, x2,…xn) and rows are different parameter/random variables sets for different calls. Returns: - g_val_sys (numpy.array of float(s)) – Performance function value for the system.
- g_val_comp (numpy.array of float(s)) – Performance function value for each component.
- msg (str) – Accompanying diagnostic message, e.g. warning.
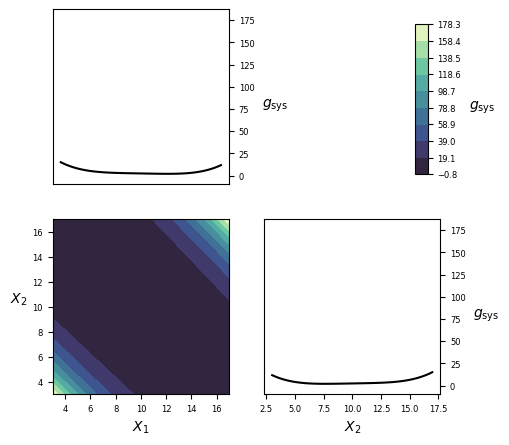
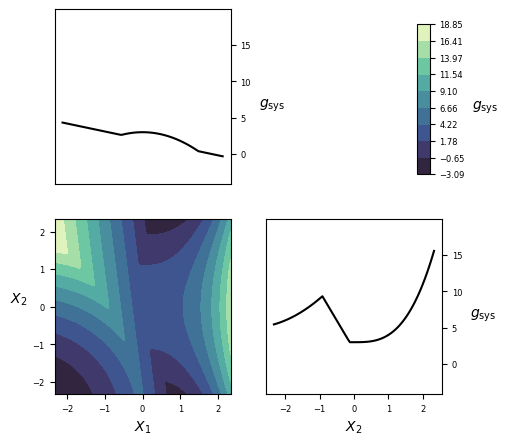
RP24
set_id |
problem_id |
|---|---|
| 1 | 2 |
Overview
| Category | Value |
|---|---|
| Type | Symbolic |
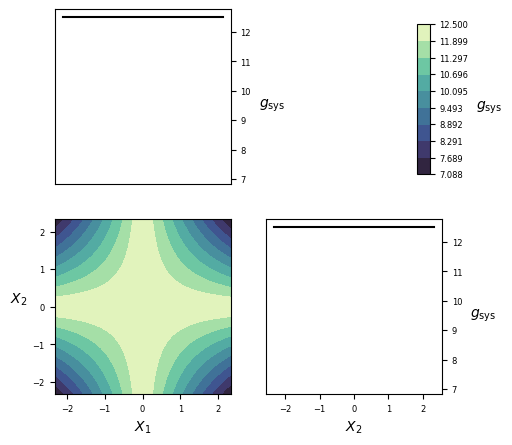
| Number of random variables | 2 |
| Failure probability, \(P_\mathrm{f}\) | \(2.86\cdot10^{-3}\) |
| Reliability index, \(\beta=-\Phi^{-1}(P_\mathrm{f})\) | 2.76 |
| Number of performance functions | 1 |
| Reference | [Grooteman2011] |
Performance function
Random variables
The parametrization of distributions follows that of in Distributions.
| Variable | Description | Distribution | \(\theta_1\) | \(\theta_2\) | \(\theta_3\) | \(\theta_4\) | Mean | Std |
|---|---|---|---|---|---|---|---|---|
| \(X_1\) | NA | Normal | 10.0 | 3.0 | 10.0 | 3.0 | ||
| \(X_2\) | NA | Normal | 10.0 | 3.0 | 10.0 | 3.0 |
The random variables are mutually independent.
Visualization
Implementation
Python
-
gfun_24(x)[source]¶ Performance function for reliability problem 22.
Parameters: x (numpy.array of float(s)) – Values of independent variables: columns are the different parameters/random variables (x1, x2,…xn) and rows are different parameter/random variables sets for different calls. Returns: - g_val_sys (numpy.array of float(s)) – Performance function value for the system.
- g_val_comp (numpy.array of float(s)) – Performance function value for each component.
- msg (str) – Accompanying diagnostic message, e.g. warning.
RP25
set_id |
problem_id |
|---|---|
| 2 | 1 |
Overview
| Category | Value |
|---|---|
| Type | Symbolic |
| Number of random variables | 2 |
| Failure probability, \(P_\mathrm{f}\) | \(6.14\cdot10^{-6}\) |
| Reliability index, \(\beta=-\Phi^{-1}(P_\mathrm{f})\) | 4.36 |
| Number of performance functions | 2 |
| Reference | [Kurtz2013] |
Performance function
Random variables
The parametrization of distributions follows that of in Distributions.
| Variable | Description | Distribution | \(\theta_1\) | \(\theta_2\) | \(\theta_3\) | \(\theta_4\) | Mean | Std |
|---|---|---|---|---|---|---|---|---|
| \(X_{1}\) | NA | Normal | 0.0 | 1.0 | 0.0 | 1.0 | ||
| \(X_{2}\) | NA | Normal | 0.0 | 1.0 | 0.0 | 1.0 |
The random variables are mutually independent.
Visualization
Implementation
Python
-
gfun_111(x)[source]¶ Performance function for reliability problem 111.
Parameters: x (numpy.array of float(s)) – Values of independent variables: columns are the different parameters/random variables (x1, x2,…xn) and rows are different parameter/random variables sets for different calls. Returns: - g_val_sys (numpy.array of float(s)) – Performance function value for the system.
- g_val_comp (numpy.array of float(s)) – Performance function value for each component.
- msg (str) – Accompanying diagnostic message, e.g. warning.
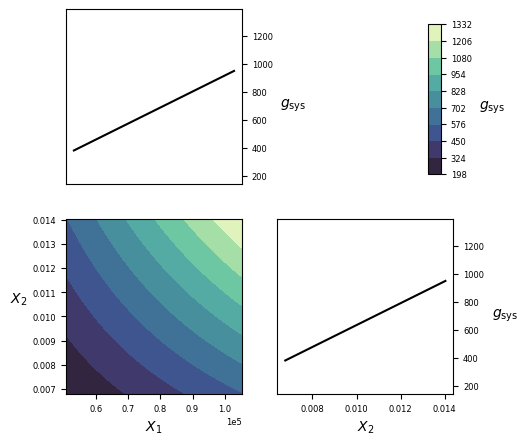
RP28
set_id |
problem_id |
|---|---|
| 1 | 3 |
Overview
| Category | Value |
|---|---|
| Type | Symbolic |
| Number of random variables | 2 |
| Failure probability, \(P_\mathrm{f}\) | \(1.46\cdot10^{-7}\) |
| Reliability index, \(\beta=-\Phi^{-1}(P_\mathrm{f})\) | 5.11 |
| Number of performance functions | 1 |
| Reference | [Grooteman2011] |
Performance function
Random variables
The parametrization of distributions follows that of in Distributions.
| Variable | Description | Distribution | \(\theta_1\) | \(\theta_2\) | \(\theta_3\) | \(\theta_4\) | Mean | Std |
|---|---|---|---|---|---|---|---|---|
| \(X_1\) | NA | Normal | 78064.0 | 11710.0 | 78064.0 | 11710.0 | ||
| \(X_2\) | NA | Normal | 0.0104 | 0.00156 | 0.0104 | 0.00156 |
The random variables are mutually independent.
Visualization
Implementation
Python
-
gfun_28(x)[source]¶ Performance function for reliability problem 28.
Parameters: x (numpy.array of float(s)) – Values of independent variables: columns are the different parameters/random variables (x1, x2,…xn) and rows are different parameter/random variables sets for different calls. Returns: - g_val_sys (numpy.array of float(s)) – Performance function value for the system.
- g_val_comp (numpy.array of float(s)) – Performance function value for each component.
- msg (str) – Accompanying diagnostic message, e.g. warning.
RP31
set_id |
problem_id |
|---|---|
| 1 | 4 |
Overview
| Category | Value |
|---|---|
| Type | Symbolic |
| Number of random variables | 2 |
| Failure probability, \(P_\mathrm{f}\) | \(1.80\cdot10^{-4}\) |
| Reliability index, \(\beta=-\Phi^{-1}(P_\mathrm{f})\) | 3.58 |
| Number of performance functions | 1 |
| Reference | [Grooteman2011] |
Performance function
Random variables
The parametrization of distributions follows that of in Distributions.
| Variable | Description | Distribution | \(\theta_1\) | \(\theta_2\) | \(\theta_3\) | \(\theta_4\) | Mean | Std |
|---|---|---|---|---|---|---|---|---|
| \(X_1\) | NA | Normal | 0.0 | 1.0 | 0.0 | 1.0 | ||
| \(X_2\) | NA | Normal | 0.0 | 1.0 | 0.0 | 1.0 |
The random variables are mutually independent.
Visualization
Implementation
Python
-
gfun_31(x)[source]¶ Performance function for reliability problem 31.
Parameters: x (numpy.array of float(s)) – Values of independent variables: columns are the different parameters/random variables (x1, x2,…xn) and rows are different parameter/random variables sets for different calls. Returns: - g_val_sys (numpy.array of float(s)) – Performance function value for the system.
- g_val_comp (numpy.array of float(s)) – Performance function value for each component.
- msg (str) – Accompanying diagnostic message, e.g. warning.
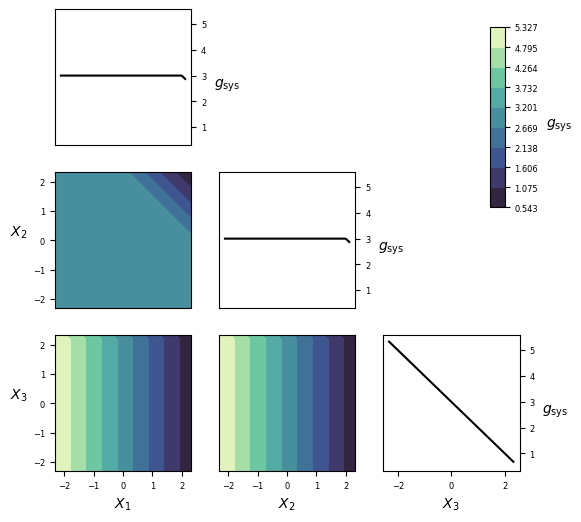
RP33
set_id |
problem_id |
|---|---|
| -1 | 3 |
| 2 | 2 |
Overview
| Category | Value |
|---|---|
| Type | Symbolic |
| Number of random variables | 3 |
| Failure probability, \(P_\mathrm{f}\) | \(2.57\cdot10^{-3}\) |
| Reliability index, \(\beta=-\Phi^{-1}(P_\mathrm{f})\) | 2.80 |
| Number of performance functions | 2 |
| Reference | [Grooteman2011] |
Performance function
Random variables
The parametrization of distributions follows that of in Distributions.
| Variable | Description | Distribution | \(\theta_1\) | \(\theta_2\) | \(\theta_3\) | \(\theta_4\) | Mean | Std |
|---|---|---|---|---|---|---|---|---|
| \(X_{1}\) | NA | Normal | 0.0 | 1.0 | 0.0 | 1.0 | ||
| \(X_{2}\) | NA | Normal | 0.0 | 1.0 | 0.0 | 1.0 | ||
| \(X_{3}\) | NA | Normal | 0.0 | 1.0 | 0.0 | 1.0 |
The random variables are mutually independent.
Visualization
Implementation
-
gfun_33(x)[source]¶ Performance function for reliability problem 33.
Parameters: x (numpy.array of float(s)) – Values of independent variables: columns are the different parameters/random variables (x1, x2,…xn) and rows are different parameter/random variables sets for different calls. Returns: - g_val_sys (numpy.array of float(s)) – Performance function value for the system.
- g_val_comp (numpy.array of float(s)) – Performance function value for each component.
- msg (str) – Accompanying diagnostic message, e.g. warning.
RP35
set_id |
problem_id |
|---|---|
| 2 | 3 |
Overview
| Category | Value |
|---|---|
| Type | Symbolic |
| Number of random variables | 2 |
| Failure probability, \(P_\mathrm{f}\) | \(3.54\cdot10^{-3}\) |
| Reliability index, \(\beta=-\Phi^{-1}(P_\mathrm{f})\) | 2.70 |
| Number of performance functions | 2 |
| Reference | [Grooteman2011] |
Performance function
Random variables
The parametrization of distributions follows that of in Distributions.
| Variable | Description | Distribution | \(\theta_1\) | \(\theta_2\) | \(\theta_3\) | \(\theta_4\) | Mean | Std |
|---|---|---|---|---|---|---|---|---|
| \(X_{1}\) | NA | Normal | 0.0 | 1.0 | 0.0 | 1.0 | ||
| \(X_{2}\) | NA | Normal | 0.0 | 1.0 | 0.0 | 1.0 |
The random variables are mutually independent.
Visualization
Implementation
-
gfun_35(x)[source]¶ Performance function for reliability problem 35.
Parameters: x (numpy.array of float(s)) – Values of independent variables: columns are the different parameters/random variables (x1, x2,…xn) and rows are different parameter/random variables sets for different calls. Returns: - g_val_sys (numpy.array of float(s)) – Performance function value for the system.
- g_val_comp (numpy.array of float(s)) – Performance function value for each component.
- msg (str) – Accompanying diagnostic message, e.g. warning.
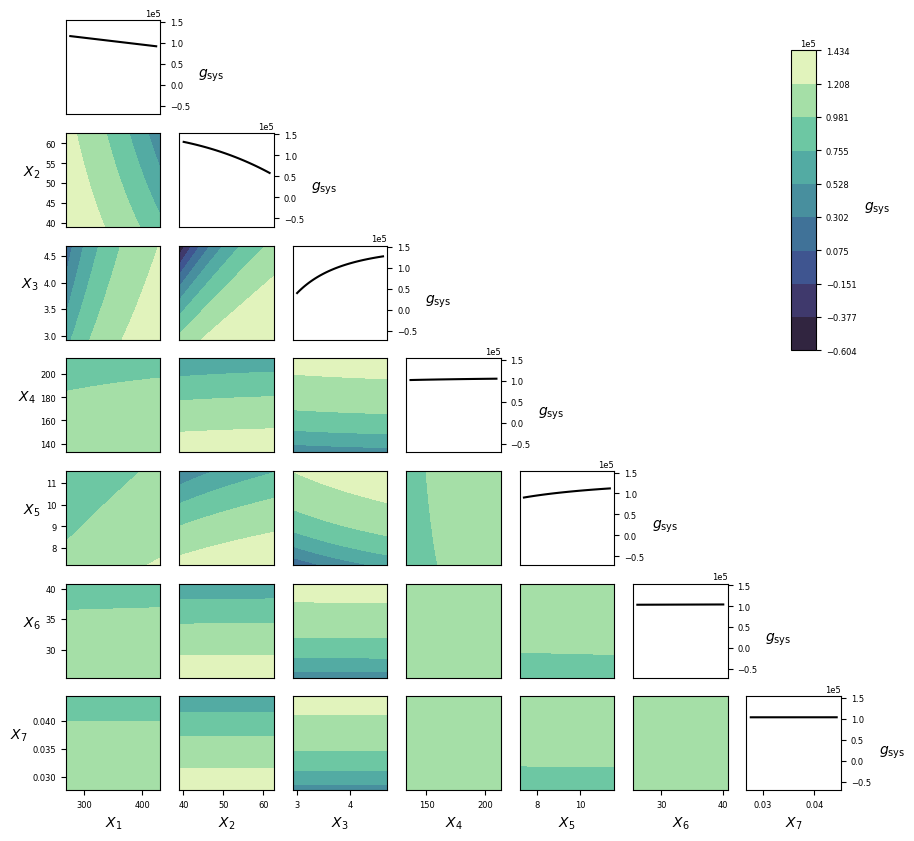
RP38
set_id |
problem_id |
|---|---|
| 1 | 5 |
Overview
| Category | Value |
|---|---|
| Type | Symbolic |
| Number of random variables | 7 |
| Failure probability, \(P_\mathrm{f}\) | \(8.10\cdot10^{-3}\) |
| Reliability index, \(\beta=-\Phi^{-1}(P_\mathrm{f})\) | 2.48 |
| Number of performance functions | 1 |
| Reference | [Yun2018] |
Performance function
Random variables
The parametrization of distributions follows that of in Distributions.
| Variable | Description | Distribution | \(\theta_1\) | \(\theta_2\) | \(\theta_3\) | \(\theta_4\) | Mean | Std |
|---|---|---|---|---|---|---|---|---|
| \(X_1\) | NA | Normal | 350.0 | 35.0 | 350.0 | 35.0 | ||
| \(X_2\) | NA | Normal | 50.8 | 5.08 | 50.8 | 5.08 | ||
| \(X_3\) | NA | Normal | 3.81 | 0.381 | 3.81 | 0.381 | ||
| \(X_4\) | NA | Normal | 173.0 | 17.3 | 173.0 | 17.3 | ||
| \(X_5\) | NA | Normal | 9.38 | 0.938 | 9.38 | 0.938 | ||
| \(X_6\) | NA | Normal | 33.1 | 3.31 | 33.1 | 3.31 | ||
| \(X_7\) | NA | Normal | 0.036 | 0.0036 | 0.036 | 0.0036 |
The random variables are mutually independent.
Visualization
Implementation
-
gfun_38(x)[source]¶ Performance function for reliability problem 38.
Parameters: x (numpy.array of float(s)) – Values of independent variables: columns are the different parameters/random variables (x1, x2,…xn) and rows are different parameter/random variables sets for different calls. Returns: - g_val_sys (numpy.array of float(s)) – Performance function value for the system.
- g_val_comp (numpy.array of float(s)) – Performance function value for each component.
- msg (str) – Accompanying diagnostic message, e.g. warning.
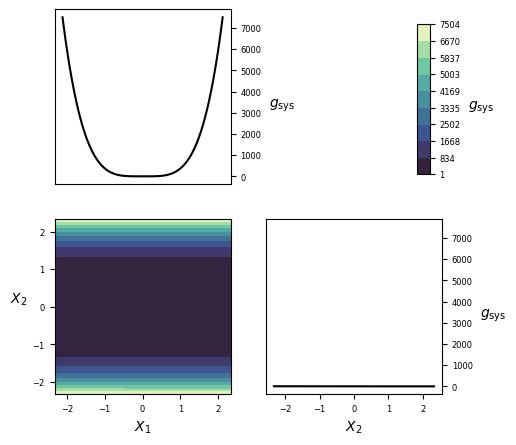
RP53
set_id |
problem_id |
|---|---|
| 1 | 6 |
Overview
| Category | Value |
|---|---|
| Type | Symbolic |
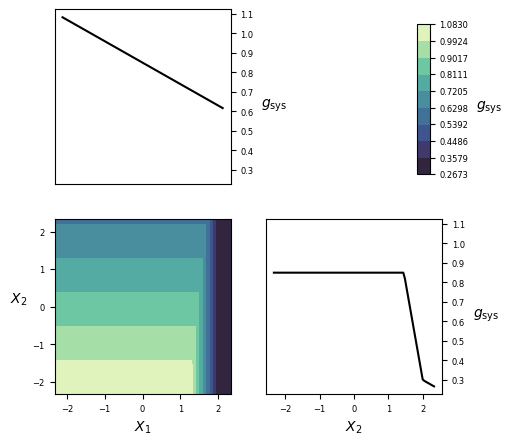
| Number of random variables | 2 |
| Failure probability, \(P_\mathrm{f}\) | \(3.13\cdot10^{-2}\) |
| Reliability index, \(\beta=-\Phi^{-1}(P_\mathrm{f})\) | 1.86 |
| Number of performance functions | 1 |
| Reference | [Xiao2018] |
Performance function
Random variables
The parametrization of distributions follows that of in Distributions.
| Variable | Description | Distribution | \(\theta_1\) | \(\theta_2\) | \(\theta_3\) | \(\theta_4\) | Mean | Std |
|---|---|---|---|---|---|---|---|---|
| \(X_1\) | NA | Normal | 1.5 | 1.0 | 1.5 | 1.0 | ||
| \(X_2\) | NA | Normal | 2.5 | 1.0 | 2.5 | 1.0 |
The random variables are mutually independent.
Visualization
Implementation
Python
-
gfun_53(x)[source]¶ Performance function for reliability problem 53.
Parameters: x (numpy.array of float(s)) – Values of independent variables: columns are the different parameters/random variables (x1, x2,…xn) and rows are different parameter/random variables sets for different calls. Returns: - g_val_sys (numpy.array of float(s)) – Performance function value for the system.
- g_val_comp (numpy.array of float(s)) – Performance function value for each component.
- msg (str) – Accompanying diagnostic message, e.g. warning.
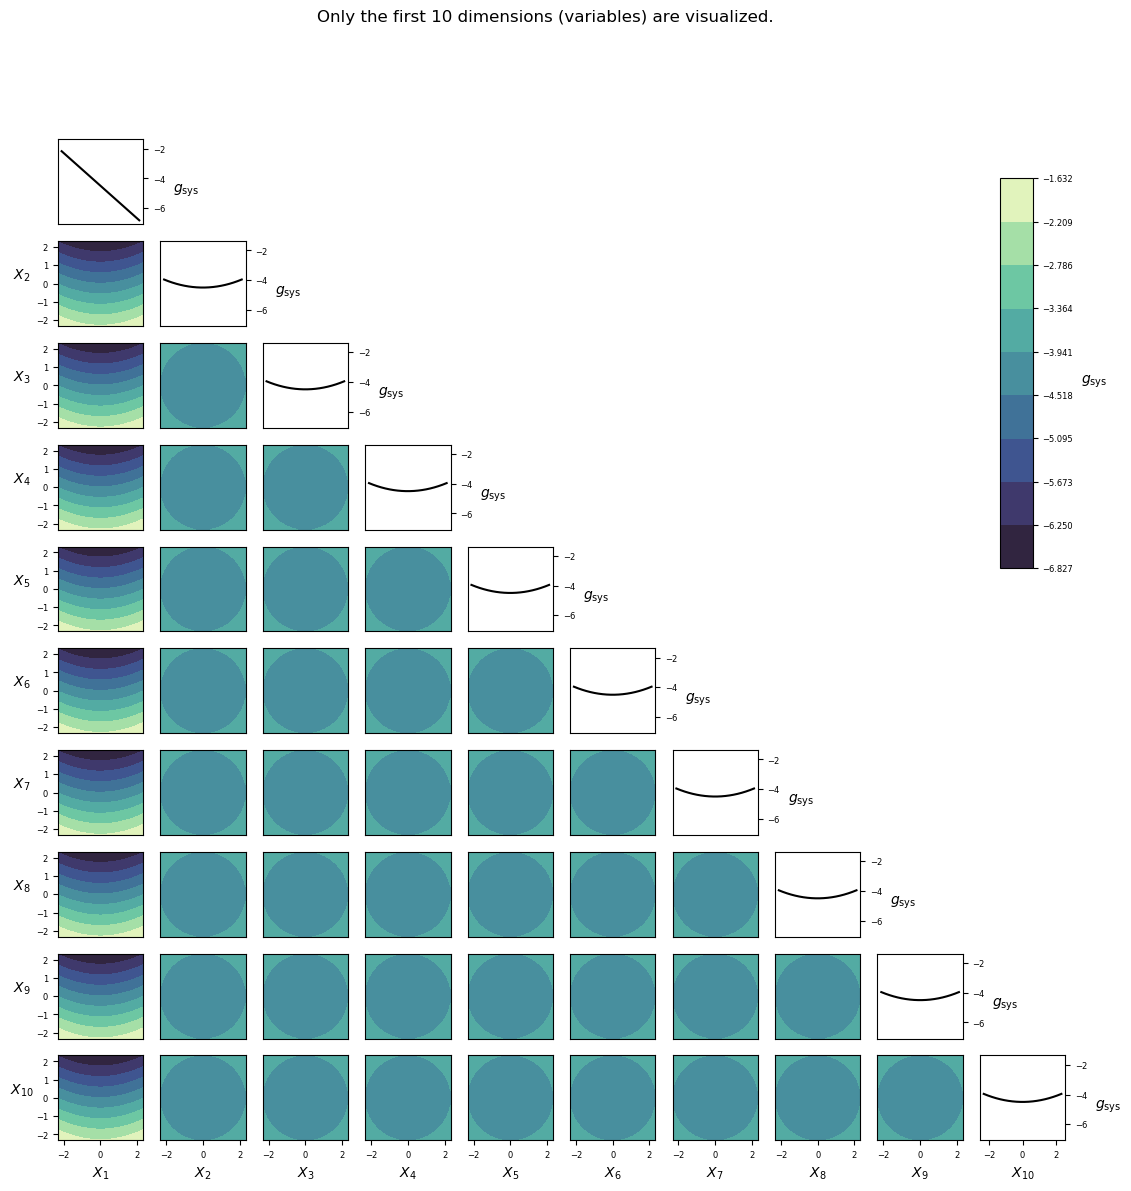
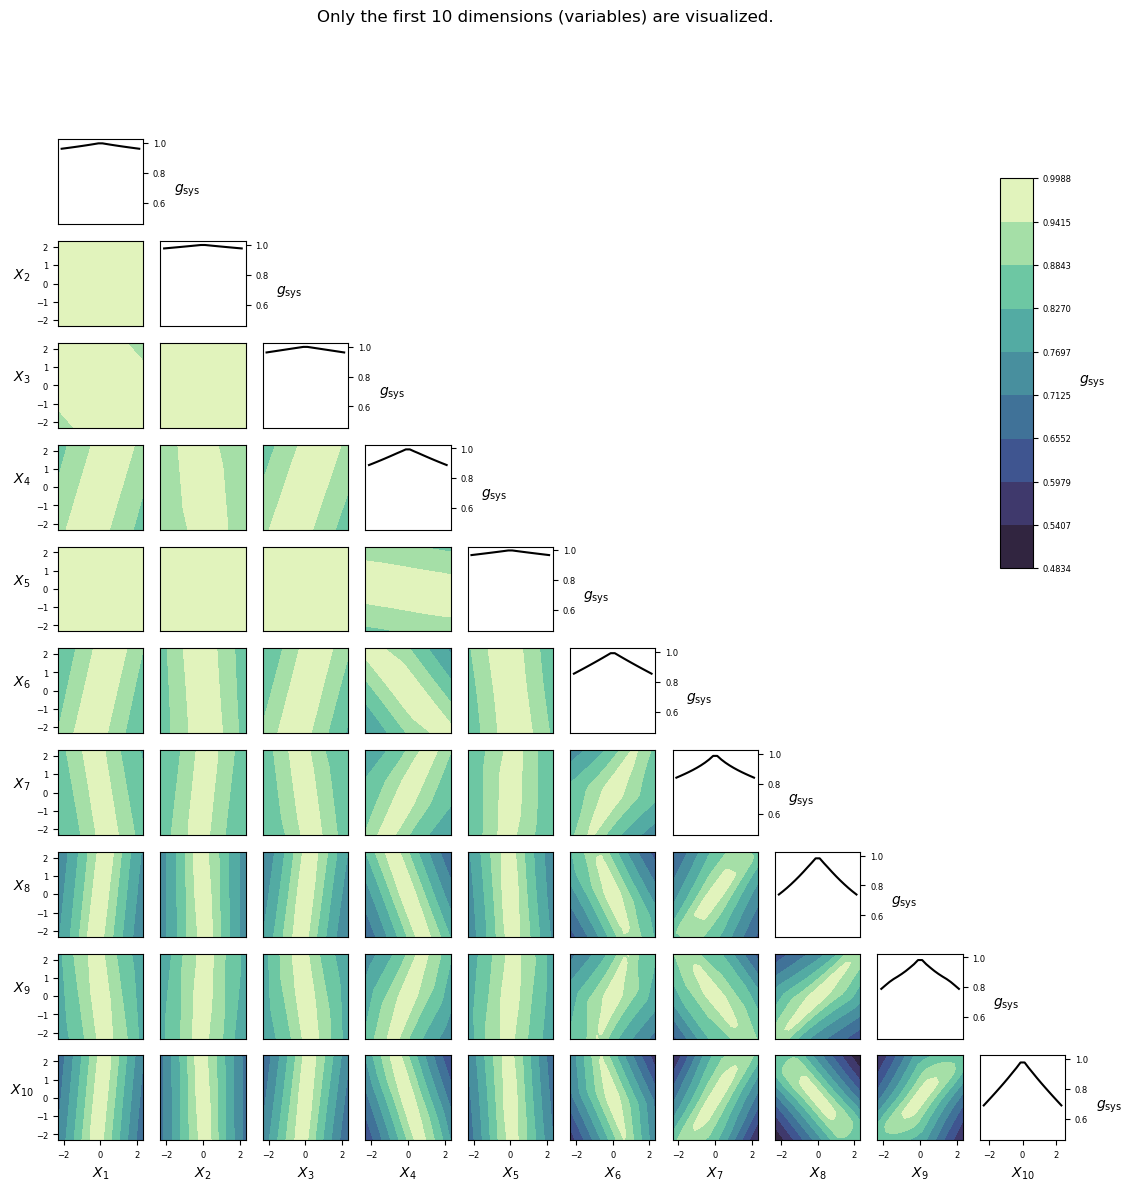
RP54
set_id |
problem_id |
|---|---|
| 1 | 7 |
Overview
| Category | Value |
|---|---|
| Type | Symbolic |
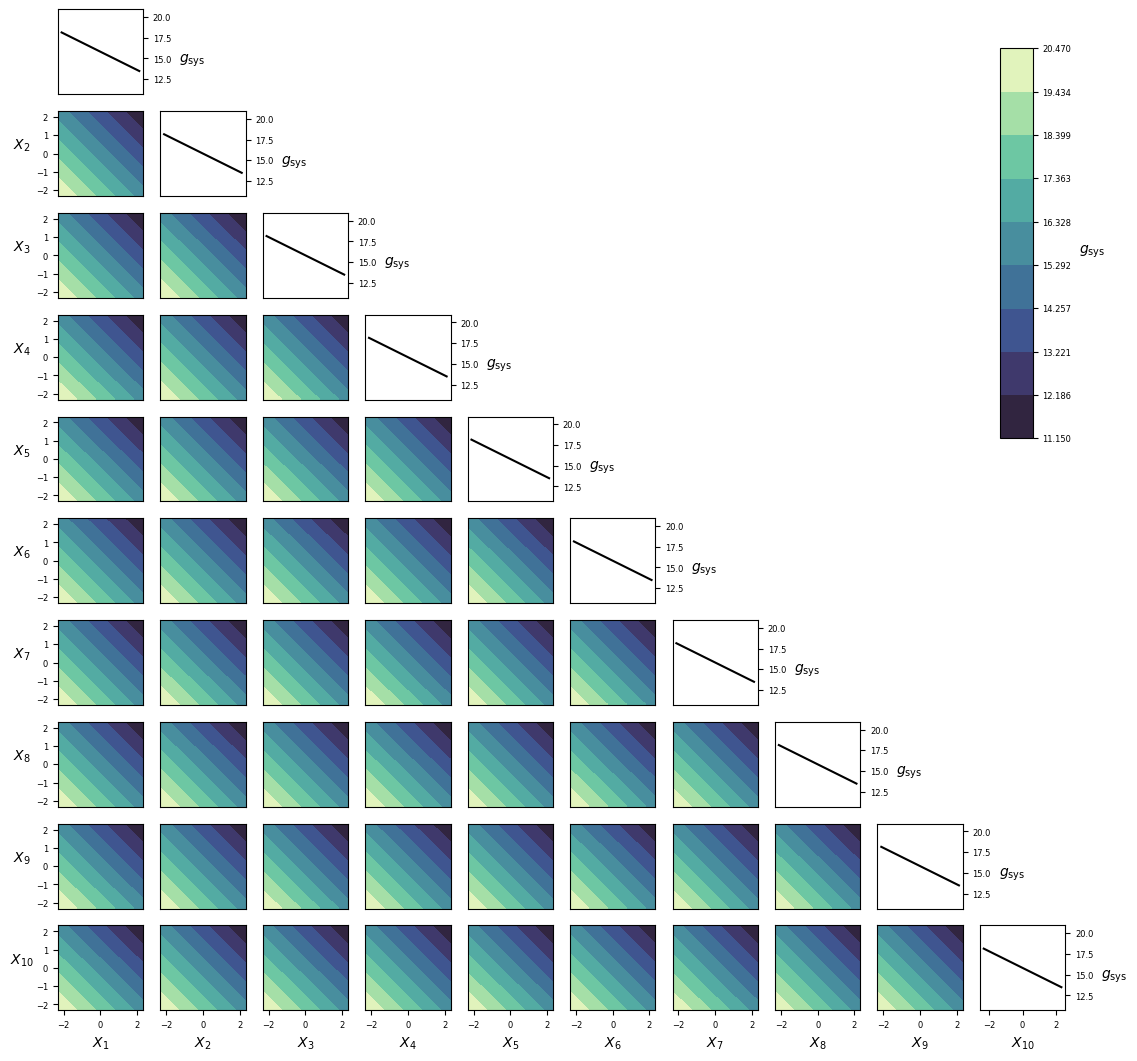
| Number of random variables | 20 |
| Failure probability, \(P_\mathrm{f}\) | \(9.98\cdot10^{-4}\) |
| Reliability index, \(\beta=-\Phi^{-1}(P_\mathrm{f})\) | 3.09 |
| Number of performance functions | 1 |
| Reference | [Engelund1993] |
Performance function
Random variables
The parametrization of distributions follows that of in Distributions.
| Variable | Description | Distribution | \(\theta_1\) | \(\theta_2\) | \(\theta_3\) | \(\theta_4\) | Mean | Std |
|---|---|---|---|---|---|---|---|---|
| \(X_1\) | NA | Exponential | 1.0 | 1.0 | 1.0 | |||
| \(\vdots\) | \(\vdots\) | \(\vdots\) | \(\vdots\) | \(\vdots\) | \(\vdots\) | \(\vdots\) | \(\vdots\) | \(\vdots\) |
| \(X_{20}\) | NA | Exponential | 1.0 | 1.0 | 1.0 |
The random variables are identically distributed and mutually independent.
Visualization
Implementation
-
gfun_54(x)[source]¶ Performance function for reliability problem 54.
Parameters: x (numpy.array of float(s)) – Values of independent variables: columns are the different parameters/random variables (x1, x2,…xn) and rows are different parameter/random variables sets for different calls. Returns: - g_val_sys (numpy.array of float(s)) – Performance function value for the system.
- g_val_comp (numpy.array of float(s)) – Performance function value for each component.
- msg (str) – Accompanying diagnostic message, e.g. warning.
RP55
set_id |
problem_id |
|---|---|
| 2 | 4 |
Overview
| Category | Value |
|---|---|
| Type | Symbolic |
| Number of random variables | 2 |
| Failure probability, \(P_\mathrm{f}\) | \(3.60\cdot10^{-1}\) |
| Reliability index, \(\beta=-\Phi^{-1}(P_\mathrm{f})\) | -0.15 |
| Number of performance functions | 4 |
| Reference | [Jiang2017] |
Performance function
Random variables
The parametrization of distributions follows that of in Distributions.
| Variable | Description | Distribution | \(\theta_1\) | \(\theta_2\) | \(\theta_3\) | \(\theta_4\) | Mean | Std |
|---|---|---|---|---|---|---|---|---|
| \(X_{1}\) | NA | Uniform | -1.0 | 1.0 | 0.0 | 0.5774 | ||
| \(X_{2}\) | NA | Uniform | -1.0 | 1.0 | 0.0 | 0.5774 |
The random variables are mutually independent.
Visualization
Implementation
Python
-
gfun_55(x)[source]¶ Performance function for reliability problem 55.
Parameters: x (numpy.array of float(s)) – Values of independent variables: columns are the different parameters/random variables (x1, x2,…xn) and rows are different parameter/random variables sets for different calls. Returns: - g_val_sys (numpy.array of float(s)) – Performance function value for the system.
- g_val_comp (numpy.array of float(s)) – Performance function value for each component.
- msg (str) – Accompanying diagnostic message, e.g. warning.
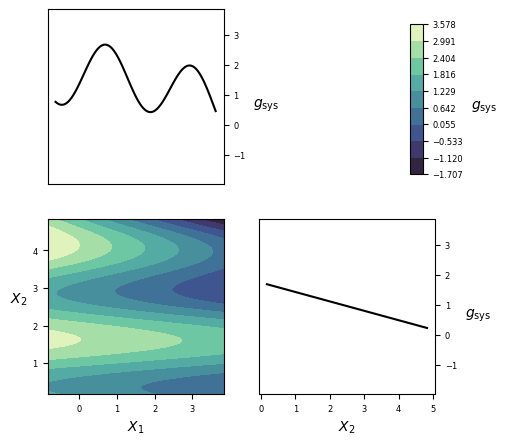
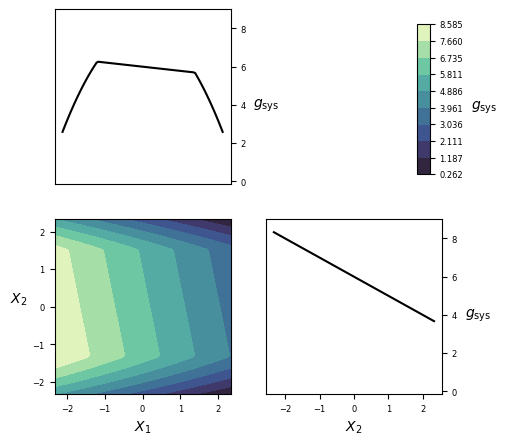
RP57
set_id |
problem_id |
|---|---|
| 2 | 5 |
Overview
| Category | Value |
|---|---|
| Type | Symbolic |
| Number of random variables | 2 |
| Failure probability, \(P_\mathrm{f}\) | \(2.84\cdot10^{-2}\) |
| Reliability index, \(\beta=-\Phi^{-1}(P_\mathrm{f})\) | 1.91 |
| Number of performance functions | 3 |
| Reference | [Wei2018] |
Performance function
Random variables
The parametrization of distributions follows that of in Distributions.
| Variable | Description | Distribution | \(\theta_1\) | \(\theta_2\) | \(\theta_3\) | \(\theta_4\) | Mean | Std |
|---|---|---|---|---|---|---|---|---|
| \(X_{1}\) | NA | Normal | 0.0 | 1.0 | 0.0 | 1.0 | ||
| \(X_{2}\) | NA | Normal | 0.0 | 1.0 | 0.0 | 1.0 |
The random variables are mutually independent.
Visualization
Implementation
Python
-
gfun_57(x)[source]¶ Performance function for reliability problem 57.
Parameters: x (numpy.array of float(s)) – Values of independent variables: columns are the different parameters/random variables (x1, x2,…xn) and rows are different parameter/random variables sets for different calls. Returns: - g_val_sys (numpy.array of float(s)) – Performance function value for the system.
- g_val_comp (numpy.array of float(s)) – Performance function value for each component.
- msg (str) – Accompanying diagnostic message, e.g. warning.
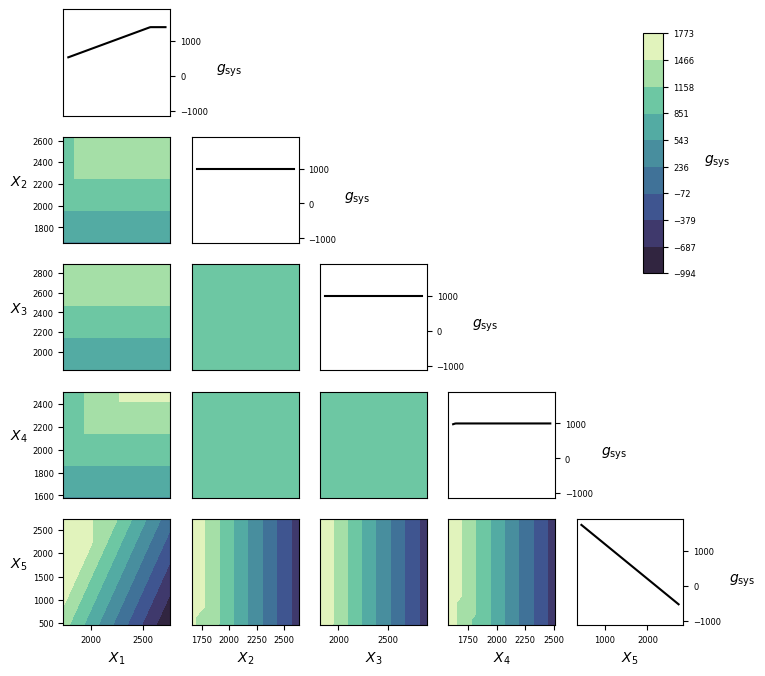
RP60
set_id |
problem_id |
|---|---|
| 2 | 6 |
Overview
| Category | Value |
|---|---|
| Type | Symbolic |
| Number of random variables | 5 |
| Failure probability, \(P_\mathrm{f}\) | \(4.56\cdot10^{-2}\) |
| Reliability index, \(\beta=-\Phi^{-1}(P_\mathrm{f})\) | 1.70 |
| Number of performance functions | 7 |
| Reference | [Wei2018] |
Performance function
Random variables
The parametrization of distributions follows that of in Distributions.
| Variable | Description | Distribution | \(\theta_1\) | \(\theta_2\) | \(\theta_3\) | \(\theta_4\) | Mean | Std |
|---|---|---|---|---|---|---|---|---|
| \(X_{1}\) | NA | Lognormal | 7.691 | 0.09975 | 2200.0 | 220.0 | ||
| \(X_{2}\) | NA | Lognormal | 7.645 | 0.09975 | 2100.0 | 210.0 | ||
| \(X_{3}\) | NA | Lognormal | 7.736 | 0.09975 | 2300.0 | 230.0 | ||
| \(X_{4}\) | NA | Lognormal | 7.596 | 0.09975 | 2000.0 | 200.0 | ||
| \(X_{5}\) | NA | Lognormal | 7.016 | 0.3853 | 1200.0 | 480.0 |
The random variables are mutually independent.
Visualization
Implementation
Python
-
gfun_60(x)[source]¶ Performance function for reliability problem 60.
Parameters: x (numpy.array of float(s)) – Values of independent variables: columns are the different parameters/random variables (x1, x2,…xn) and rows are different parameter/random variables sets for different calls. Returns: - g_val_sys (numpy.array of float(s)) – Performance function value for the system.
- g_val_comp (numpy.array of float(s)) – Performance function value for each component.
- msg (str) – Accompanying diagnostic message, e.g. warning.
RP63
set_id |
problem_id |
|---|---|
| 1 | 8 |
Overview
| Category | Value |
|---|---|
| Type | Symbolic |
| Number of random variables | 100 |
| Failure probability, \(P_\mathrm{f}\) | \(3.79\cdot10^{-4}\) |
| Reliability index, \(\beta=-\Phi^{-1}(P_\mathrm{f})\) | 3.36 |
| Number of performance functions | 1 |
| Reference | [Depina2016] |
Performance function
Random variables
The parametrization of distributions follows that of in Distributions.
| Variable | Description | Distribution | \(\theta_1\) | \(\theta_2\) | \(\theta_3\) | \(\theta_4\) | Mean | Std |
|---|---|---|---|---|---|---|---|---|
| \(X_1\) | NA | Normal | 0.0 | 1.0 | 0.0 | 1.0 | ||
| \(\vdots\) | \(\vdots\) | \(\vdots\) | \(\vdots\) | \(\vdots\) | \(\vdots\) | \(\vdots\) | \(\vdots\) | \(\vdots\) |
| \(X_{100}\) | NA | Normal | 0.0 | 1.0 | 0.0 | 1.0 |
The random variables are mutually independent.
Visualization
Implementation
Python
-
gfun_63(x)[source]¶ Performance function for reliability problem 63.
Parameters: x (numpy.array of float(s)) – Values of independent variables: columns are the different parameters/random variables (x1, x2,…xn) and rows are different parameter/random variables sets for different calls. Returns: - g_val_sys (numpy.array of float(s)) – Performance function value for the system.
- g_val_comp (numpy.array of float(s)) – Performance function value for each component.
- msg (str) – Accompanying diagnostic message, e.g. warning.
RP75
set_id |
problem_id |
|---|---|
| 1 | 9 |
Overview
| Category | Value |
|---|---|
| Type | Symbolic |
| Number of random variables | 2 |
| Failure probability, \(P_\mathrm{f}\) | \(1.07\cdot10^{-2}\) |
| Reliability index, \(\beta=-\Phi^{-1}(P_\mathrm{f})\) | 2.33 |
| Number of performance functions | 1 |
| Reference | [Waarts2000] |
Performance function
Random variables
The parametrization of distributions follows that of in Distributions.
| Variable | Description | Distribution | \(\theta_1\) | \(\theta_2\) | \(\theta_3\) | \(\theta_4\) | Mean | Std |
|---|---|---|---|---|---|---|---|---|
| \(X_1\) | NA | Normal | 0.0 | 1.0 | 0.0 | 1.0 | ||
| \(X_2\) | NA | Normal | 0.0 | 1.0 | 0.0 | 1.0 |
The random variables are mutually independent.
Visualization
Implementation
Python
-
gfun_75(x)[source]¶ Performance function for reliability problem 75.
Parameters: x (numpy.array of float(s)) – Values of independent variables: columns are the different parameters/random variables (x1, x2,…xn) and rows are different parameter/random variables sets for different calls. Returns: - g_val_sys (numpy.array of float(s)) – Performance function value for the system.
- g_val_comp (numpy.array of float(s)) – Performance function value for each component.
- msg (str) – Accompanying diagnostic message, e.g. warning.
RP77
set_id |
problem_id |
|---|---|
| 2 | 7 |
Overview
| Category | Value |
|---|---|
| Type | Symbolic |
| Number of random variables | 3 |
| Failure probability, \(P_\mathrm{f}\) | \(2.87\cdot10^{-7}\) |
| Reliability index, \(\beta=-\Phi^{-1}(P_\mathrm{f})\) | 5.00 |
| Number of performance functions | 2 |
| Reference | [Waarts2000] |
Performance function
Random variables
The parametrization of distributions follows that of in Distributions.
| Variable | Description | Distribution | \(\theta_1\) | \(\theta_2\) | \(\theta_3\) | \(\theta_4\) | Mean | Std |
|---|---|---|---|---|---|---|---|---|
| \(X_{1}\) | NA | Normal | 10.0 | 0.5 | 10.0 | 0.5 | ||
| \(X_{2}\) | NA | Normal | 0.0 | 1.0 | 0.0 | 1.0 | ||
| \(X_{3}\) | NA | Normal | 4.0 | 1.0 | 4.0 | 1.0 |
The random variables are mutually independent.
Implementation
-
gfun_77(x)[source]¶ Performance function for reliability problem 77.
Parameters: x (numpy.array of float(s)) – Values of independent variables: columns are the different parameters/random variables (x1, x2,…xn) and rows are different parameter/random variables sets for different calls. Returns: - g_val_sys (numpy.array of float(s)) – Performance function value for the system.
- g_val_comp (numpy.array of float(s)) – Performance function value for each component.
- msg (str) – Accompanying diagnostic message, e.g. warning.
RP89
set_id |
problem_id |
|---|---|
| 2 | 8 |
Overview
| Category | Value |
|---|---|
| Type | Symbolic |
| Number of random variables | 2 |
| Failure probability, \(P_\mathrm{f}\) | \(5.43\cdot10^{-3}\) |
| Reliability index, \(\beta=-\Phi^{-1}(P_\mathrm{f})\) | 2.55 |
| Number of performance functions | 2 |
| Reference | [Bichon2011] |
Performance function
Random variables
The parametrization of distributions follows that of in Distributions.
| Variable | Description | Distribution | \(\theta_1\) | \(\theta_2\) | \(\theta_3\) | \(\theta_4\) | Mean | Std |
|---|---|---|---|---|---|---|---|---|
| \(X_{1}\) | NA | Normal | 0.0 | 1.0 | 0.0 | 1.0 | ||
| \(X_{2}\) | NA | Normal | 0.0 | 1.0 | 0.0 | 1.0 |
The random variables are mutually independent.
Visualization
Implementation
Python
-
gfun_89(x)[source]¶ Performance function for reliability problem 89.
Parameters: x (numpy.array of float(s)) – Values of independent variables: columns are the different parameters/random variables (x1, x2,…xn) and rows are different parameter/random variables sets for different calls. Returns: - g_val_sys (numpy.array of float(s)) – Performance function value for the system.
- g_val_comp (numpy.array of float(s)) – Performance function value for each component.
- msg (str) – Accompanying diagnostic message, e.g. warning.
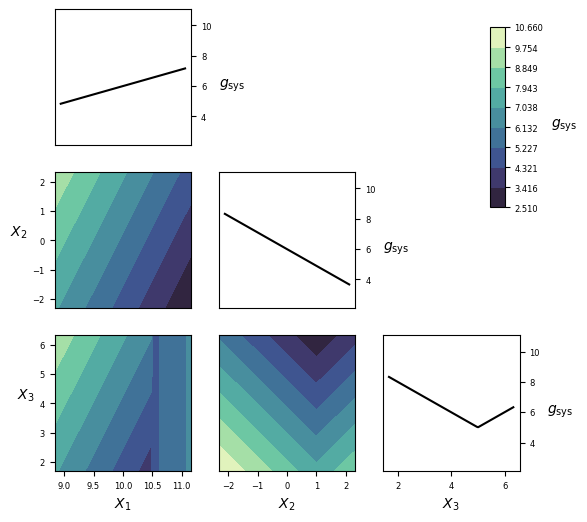
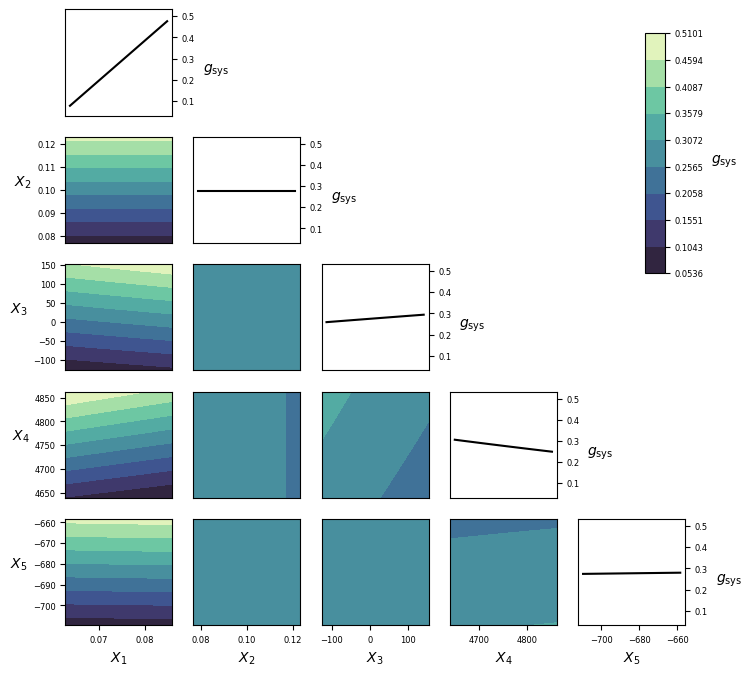
RP91
set_id |
problem_id |
|---|---|
| 2 | 9 |
Overview
| Category | Value |
|---|---|
| Type | Symbolic |
| Number of random variables | 5 |
| Failure probability, \(P_\mathrm{f}\) | \(6.97\cdot10^{-4}\) |
| Reliability index, \(\beta=-\Phi^{-1}(P_\mathrm{f})\) | 3.19 |
| Number of performance functions | 3 |
| Reference | [Bichon2011] |
Performance function
Random variables
The parametrization of distributions follows that of in Distributions.
| Variable | Description | Distribution | \(\theta_1\) | \(\theta_2\) | \(\theta_3\) | \(\theta_4\) | Mean | Std |
|---|---|---|---|---|---|---|---|---|
| \(X_{1}\) | NA | Normal | 0.07433 | 0.005 | 0.07433 | 0.005 | ||
| \(X_{2}\) | NA | Normal | 0.1 | 0.01 | 0.1 | 0.01 | ||
| \(X_{3}\) | NA | Normal | 13.0 | 60.0 | 13.0 | 60.0 | ||
| \(X_{4}\) | NA | Normal | 4751.0 | 48.0 | 4751.0 | 48.0 | ||
| \(X_{5}\) | NA | Normal | -684.0 | 11.0 | -684.0 | 11.0 |
The random variables are mutually independent.
Visualization
Implementation
Python
-
gfun_91(x)[source]¶ Performance function for reliability problem 91.
Parameters: x (numpy.array of float(s)) – Values of independent variables: columns are the different parameters/random variables (x1, x2,…xn) and rows are different parameter/random variables sets for different calls. Returns: - g_val_sys (numpy.array of float(s)) – Performance function value for the system.
- g_val_comp (numpy.array of float(s)) – Performance function value for each component.
- msg (str) – Accompanying diagnostic message, e.g. warning.
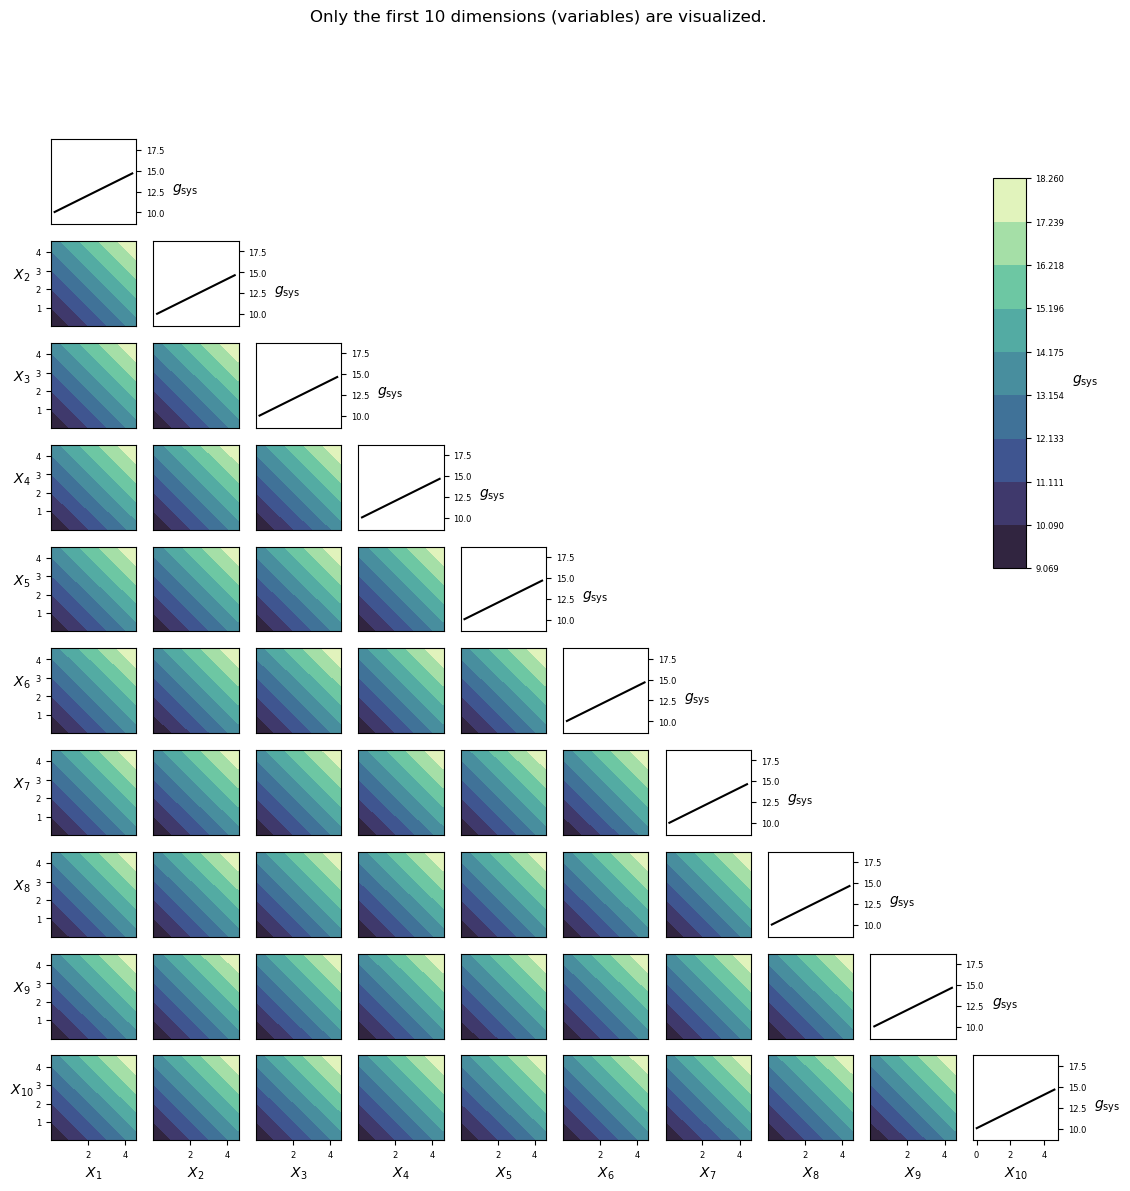
RP107
set_id |
problem_id |
|---|---|
| 1 | 10 |
Overview
| Category | Value |
|---|---|
| Type | Symbolic |
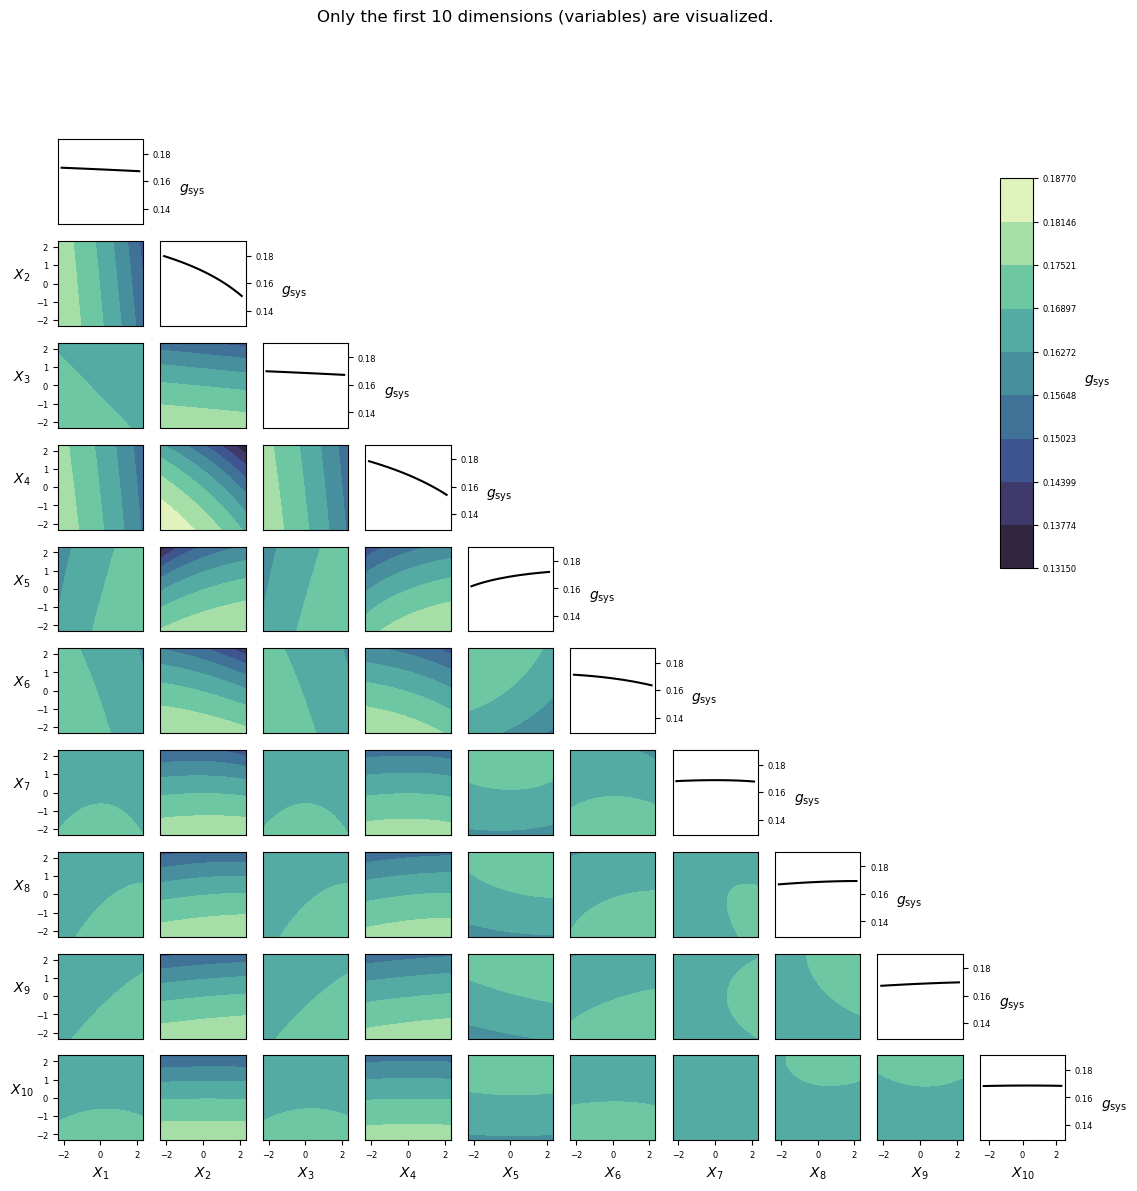
| Number of random variables | 10 |
| Failure probability, \(P_\mathrm{f}\) | \(2.92\cdot10^{-7}\) |
| Reliability index, \(\beta=-\Phi^{-1}(P_\mathrm{f})\) | 5.0 |
| Number of performance functions | 1 |
| Reference | [Engelund1993] |
Performance function
Random variables
The parametrization of distributions follows that of in Distributions.
| Variable | Description | Distribution | \(\theta_1\) | \(\theta_2\) | \(\theta_3\) | \(\theta_4\) | Mean | Std |
|---|---|---|---|---|---|---|---|---|
| \(X_1\) | NA | Normal | 0.0 | 1.0 | 0.0 | 1.0 | ||
| \(\vdots\) | \(\vdots\) | \(\vdots\) | \(\vdots\) | \(\vdots\) | \(\vdots\) | \(\vdots\) | \(\vdots\) | \(\vdots\) |
| \(X_{10}\) | NA | Normal | 0.0 | 1.0 | 0.0 | 1.0 |
The random variables are identically distributed and mutually independent.
Visualization
Implementation
Python
-
gfun_107(x)[source]¶ Performance function for reliability problem 107.
Parameters: x (numpy.array of float(s)) – Values of independent variables: columns are the different parameters/random variables (x1, x2,…xn) and rows are different parameter/random variables sets for different calls. Returns: - g_val_sys (numpy.array of float(s)) – Performance function value for the system.
- g_val_comp (numpy.array of float(s)) – Performance function value for each component.
- msg (str) – Accompanying diagnostic message, e.g. warning.
RP110
set_id |
problem_id |
|---|---|
| 2 | 10 |
Overview
| Category | Value |
|---|---|
| Type | Symbolic |
| Number of random variables | 2 |
| Failure probability, \(P_\mathrm{f}\) | \(3.19\cdot10^{-5}\) |
| Reliability index, \(\beta=-\Phi^{-1}(P_\mathrm{f})\) | 4.00 |
| Number of performance functions | 2 |
| Reference | [Breitung2019] |
Performance function
Random variables
The parametrization of distributions follows that of in Distributions.
| Variable | Description | Distribution | \(\theta_1\) | \(\theta_2\) | \(\theta_3\) | \(\theta_4\) | Mean | Std |
|---|---|---|---|---|---|---|---|---|
| \(X_{1}\) | NA | Normal | 0.0 | 1.0 | 0.0 | 1.0 | ||
| \(X_{2}\) | NA | Normal | 0.0 | 1.0 | 0.0 | 1.0 |
The random variables are mutually independent.
Visualization
Implementation
Python
-
gfun_110(x)[source]¶ Performance function for reliability problem 25.
Parameters: x (numpy.array of float(s)) – Values of independent variables: columns are the different parameters/random variables (x1, x2,…xn) and rows are different parameter/random variables sets for different calls. Returns: - g_val_sys (numpy.array of float(s)) – Performance function value for the system.
- g_val_comp (numpy.array of float(s)) – Performance function value for each component.
- msg (str) – Accompanying diagnostic message, e.g. warning.
RP111
set_id |
problem_id |
|---|---|
| 1 | 11 |
Overview
| Category | Value |
|---|---|
| Type | Symbolic |
| Number of random variables | 2 |
| Failure probability, \(P_\mathrm{f}\) | \(7.65\cdot10^{-7}\) |
| Reliability index, \(\beta=-\Phi^{-1}(P_\mathrm{f})\) | 4.81 |
| Number of performance functions | 1 |
| Reference | [Breitung2019] |
Performance function
Random variables
The parametrization of distributions follows that of in Distributions.
| Variable | Description | Distribution | \(\theta_1\) | \(\theta_2\) | \(\theta_3\) | \(\theta_4\) | Mean | Std |
|---|---|---|---|---|---|---|---|---|
| \(X_1\) | NA | Normal | 0.0 | 1.0 | 0.0 | 1.0 | ||
| \(X_2\) | NA | Normal | 0.0 | 1.0 | 0.0 | 1.0 |
The random variables are mutually independent.
Visualization
Implementation
Python
-
gfun_111(x)[source] Performance function for reliability problem 111.
Parameters: x (numpy.array of float(s)) – Values of independent variables: columns are the different parameters/random variables (x1, x2,…xn) and rows are different parameter/random variables sets for different calls. Returns: - g_val_sys (numpy.array of float(s)) – Performance function value for the system.
- g_val_comp (numpy.array of float(s)) – Performance function value for each component.
- msg (str) – Accompanying diagnostic message, e.g. warning.
RP201
set_id |
problem_id |
|---|---|
| 1 | 12 |
Overview
| Category | Value |
|---|---|
| Type | Numerical (finite element analysis) |
| Number of random variables | 21 |
| Failure probability, \(P_\mathrm{f}\) | \(1.05\cdot10^{-4}\) |
| Reliability index, \(\beta=-\Phi^{-1}(P_\mathrm{f})\) | 3.7 |
| Number of performance functions | 1 |
| Reference | [Blatman2010] |
Performance function
Too complex to be written here, see the implementation in the code repository.
Random variables
| Variable | Description | Distribution | \(\theta_1\) | \(\theta_2\) | \(\theta_3\) | \(\theta_4\) | Mean | Std |
|---|---|---|---|---|---|---|---|---|
| \(X_1\) | NA | Normal | 0.0 | 1.0 | 0.0 | 1.0 | ||
| \(\vdots\) | \(\vdots\) | \(\vdots\) | \(\vdots\) | \(\vdots\) | \(\vdots\) | \(\vdots\) | \(\vdots\) | \(\vdots\) |
| \(X_{21}\) | NA | Normal | 0.0 | 1.0 | 0.0 | 1.0 |
The random variables are mutually independent.
Visualization
Implementation
Python
-
gfun_201(x)[source]¶ Performance function for reliability problem 201.
Parameters: x (numpy.array of float(s)) – Values of independent variables: columns are the different parameters/random variables (x1, x2,…xn) and rows are different parameter/random variables sets for different calls. Returns: - g_val_sys (numpy.array of float(s)) – Performance function value for the system.
- g_val_comp (numpy.array of float(s)) – Performance function value for each component.
- msg (str) – Accompanying diagnostic message, e.g. warning.
RP202
set_id |
problem_id |
|---|---|
| 2 | 11 |
Overview
| Category | Value |
|---|---|
| Type | Numerical (finite element analysis) |
| Number of random variables | 225 |
| Failure probability, \(P_\mathrm{f}\) | \(6.03\cdot10^{-5}\) |
| Reliability index, \(\beta=-\Phi^{-1}(P_\mathrm{f})\) | 3.43 |
| Number of performance functions | 2 |
| Reference | [Schueller2007] |
Performance function
Too complex to be written here, see the implementation in the code repository.
Random variables
| Variable | Description | Distribution | \(\theta_1\) | \(\theta_2\) | \(\theta_3\) | \(\theta_4\) | Mean | Std |
|---|---|---|---|---|---|---|---|---|
| \(X_1\) | NA | Normal | 0.0 | 1.0 | 0.0 | 1.0 | ||
| \(\vdots\) | \(\vdots\) | \(\vdots\) | \(\vdots\) | \(\vdots\) | \(\vdots\) | \(\vdots\) | \(\vdots\) | \(\vdots\) |
| \(X_{225}\) | NA | Normal | 0.0 | 1.0 | 0.0 | 1.0 |
The random variables are mutually independent.
Visualization
Implementation
Python
-
gfun_202(x)[source]¶ Performance function for reliability problem 202.
Parameters: x (numpy.array of float(s)) – Values of independent variables: columns are the different parameters/random variables (x1, x2,…xn) and rows are different parameter/random variables sets for different calls. Returns: - g_val_sys (numpy.array of float(s)) – Performance function value for the system.
- g_val_comp (numpy.array of float(s)) – Performance function value for each component.
- msg (str) – Accompanying diagnostic message, e.g. warning.
RP203
set_id |
problem_id |
|---|---|
| 1 | 13 |
Overview
| Category | Value |
|---|---|
| Type | Numerical (finite element analysis surrogate) |
| Number of random variables | 4 |
| Failure probability, \(P_\mathrm{f}\) | \(4.33\cdot10^{-7}\) |
| Reliability index, \(\beta=-\Phi^{-1}(P_\mathrm{f})\) | 4.92 |
| Number of performance functions | 1 |
| Reference | [Eijnden2019] |
Performance function
Too complex to be written here, see the implementation in the code repository.
Random variables
The parametrization of distributions follows that of in Distributions.
| Variable | Description | Distribution | \(\theta_1\) | \(\theta_2\) | \(\theta_3\) | \(\theta_4\) | Mean | Std |
|---|---|---|---|---|---|---|---|---|
| \(X_{1}\) | NA | Normal | 0.0 | 1.0 | 0.0 | 1.0 | ||
| \(X_{2}\) | NA | Normal | 0.0 | 1.0 | 0.0 | 1.0 | ||
| \(X_{3}\) | NA | Normal | 0.0 | 1.0 | 0.0 | 1.0 | ||
| \(X_{4}\) | NA | Normal | 0.0 | 1.0 | 0.0 | 1.0 |
The random variables are mutually independent.
Visualization
Implementation
Python
-
gfun_203(x)[source]¶ Performance function for reliability problem 203. Bram’s geotechnical problem.
Parameters: x (numpy.array of float(s)) – Values of independent variables: columns are the different parameters/random variables (x1, x2,…xn) and rows are different parameter/random variables sets for different calls. Returns: - g_val_sys (numpy.array of float(s)) – Performance function value for the system.
- g_val_comp (numpy.array of float(s)) – Performance function value for each component.
- msg (str) – Accompanying diagnostic message, e.g. warning.
RP213
set_id |
problem_id |
|---|---|
| 1 | 14 |
Overview
| Category | Value |
|---|---|
| Type | Numeric (finite element analysis) |
| Number of random variables | 13 |
| Failure probability, \(P_\mathrm{f}\) | \(2.84\cdot10^{-4}\) |
| Reliability index, \(\beta=-\Phi^{-1}(P_\mathrm{f})\) | 3.45 |
| Number of performance functions | 1 |
| Reference | [Blatman2010] |
Performance function
Too complex to be written here, see the implementation in the code repository.
Random variables
| Variable | Description | Distribution | \(\theta_1\) | \(\theta_2\) | \(\theta_3\) | \(\theta_4\) | Mean | Std |
|---|---|---|---|---|---|---|---|---|
| \(X_1\) | NA | Normal | 0.0 | 1.0 | 0.0 | 1.0 | ||
| \(\vdots\) | \(\vdots\) | \(\vdots\) | \(\vdots\) | \(\vdots\) | \(\vdots\) | \(\vdots\) | \(\vdots\) | \(\vdots\) |
| \(X_{13}\) | NA | Normal | 0.0 | 1.0 | 0.0 | 1.0 |
The random variables are mutually independent.
Visualization

Implementation
Python
-
gfun_213_le_frame(x)[source]¶ Performance function for reliability problem 213.
Parameters: x (numpy.array of float(s)) – Values of independent variables: columns are the different parameters/random variables (x1, x2,…xn) and rows are different parameter/random variables sets for different calls. Returns: - g_val_sys (numpy.array of float(s)) – Performance function value for the system.
- g_val_comp (numpy.array of float(s)) – Performance function value for each component.
- msg (str) – Accompanying diagnostic message, e.g. warning.
RP300
set_id |
problem_id |
|---|---|
| 1 | 15 |
Overview
| Category | Value |
|---|---|
| Type | Numerical |
| Number of random variables | 14 |
| Failure probability, \(P_\mathrm{f}\) | \(5.22\cdot10^{-5}\) |
| Reliability index, \(\beta=-\Phi^{-1}(P_\mathrm{f})\) | 3.88 |
| Number of performance functions | 1 |
| Reference | [Sepulveda2019] |
Performance function
Too complex to be written here, see the implementation in the code repository.
Random variables
The parametrization of distributions follows that of in Distributions.
| Variable | Description | Distribution | \(\theta_1\) | \(\theta_2\) | \(\theta_3\) | \(\theta_4\) | Mean | Std |
|---|---|---|---|---|---|---|---|---|
| \(X_1\) | DACC | Normal | 0 | 1 | ||||
| \(X_2\) | DACC | Normal | 0 | 1 | ||||
| \(\vdots\) | \(\vdots\) | \(\vdots\) | \(\vdots\) | \(\vdots\) | ||||
| \(X_{14}\) | DACC | Normal | 0 | 1 |
The random variables are mutually independent.
Visualization
Implementation
Python
-
gfun_300(x)[source]¶ Performance function for reliability problem 300.
Parameters: x (numpy.array of float(s)) – Values of independent variables: columns are the different parameters/random variables (x1, x2,…xn) and rows are different parameter/random variables sets for different calls. Returns: - g_val_sys (numpy.array of float(s)) – Performance function value for the system.
- g_val_comp (numpy.array of float(s)) – Performance function value for each component.
- msg (str) – Accompanying diagnostic message, e.g. warning.
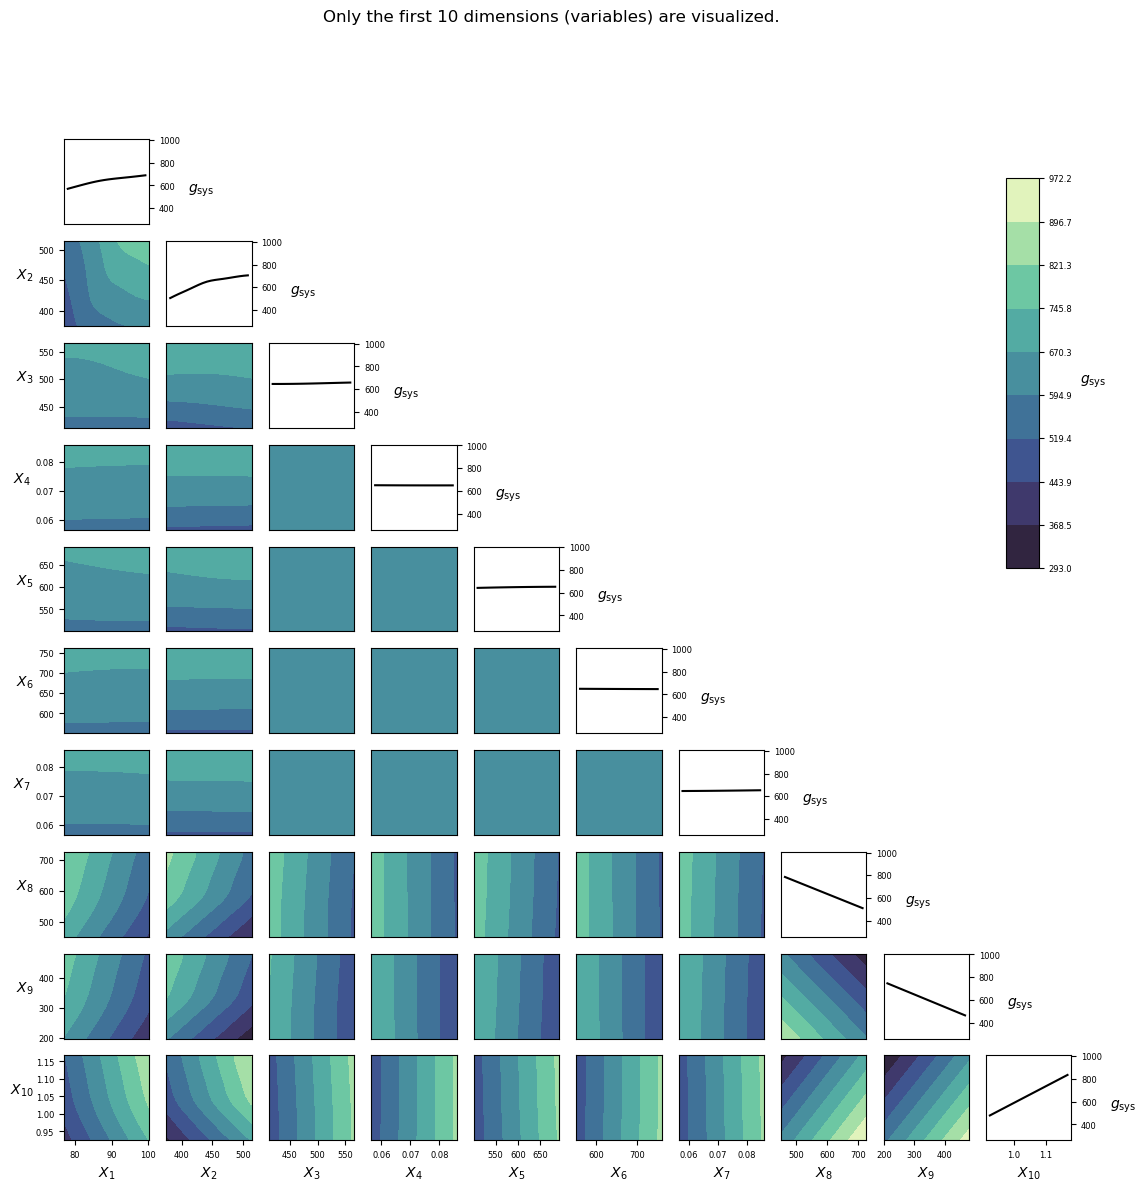
RP301
set_id |
problem_id |
|---|---|
| 1 | 16 |
Overview
| Category | Value |
|---|---|
| Type | Numerical (finite element analysis surrogate) |
| Number of random variables | 12 |
| Failure probability, \(P_\mathrm{f}\) | \(6.9\cdot10^{-5}\) |
| Reliability index, \(\beta=-\Phi^{-1}(P_\mathrm{f})\) | 3.81 |
| Number of performance functions | 1 |
| Reference | [Slobbe2019] |
Performance function
Too complex to be written here, see the implementation in the code repository.
Random variables
The parametrization of distributions follows that of in Distributions.
| Variable | Description | Distribution | \(\theta_1\) | \(\theta_2\) | \(\theta_3\) | \(\theta_4\) | Mean | Std |
|---|---|---|---|---|---|---|---|---|
| \(X_{1}\) | NA | Lognormal | 4.476 | 0.05677 | 88.0 | 5.0 | ||
| \(X_{2}\) | NA | Lognormal | 6.084 | 0.0681 | 440.0 | 30.0 | ||
| \(X_{3}\) | NA | Lognormal | 6.18 | 0.0681 | 484.0 | 33.0 | ||
| \(X_{4}\) | NA | Lognormal | -2.663 | 0.08982 | 0.07 | 0.0063 | ||
| \(X_{5}\) | NA | Lognormal | 6.378 | 0.06941 | 590.0 | 41.0 | ||
| \(X_{6}\) | NA | Lognormal | 6.473 | 0.06925 | 649.0 | 45.0 | ||
| \(X_{7}\) | NA | Lognormal | -2.663 | 0.08982 | 0.07 | 0.0063 | ||
| \(X_{8}\) | NA | Normal | 590.0 | 59.0 | 590.0 | 59.0 | ||
| \(X_{9}\) | NA | Gumbel-max | 268.4 | 46.0 | 295.0 | 59.0 | ||
| \(X_{10}\) | NA | Lognormal | 0.03797 | 0.04997 | 1.04 | 0.052 | ||
| \(X_{11}\) | NA | Lognormal | -0.004975 | 0.09975 | 1.0 | 0.1 | ||
| \(X_{12}\) | NA | Lognormal | -0.004975 | 0.09975 | 1.0 | 0.1 |
The random variables are mutually independent.
Visualization
Implementation
Python
-
gfun_301(x)[source]¶ Performance function for reliability problem 301. High strength RC deep beam.
Parameters: x (numpy.array of float(s)) – Values of independent variables: columns are the different parameters/random variables (x1, x2,…xn) and rows are different parameter/random variables sets for different calls. Returns: - g_val_sys (numpy.array of float(s)) – Performance function value for the system.
- g_val_comp (numpy.array of float(s)) – Performance function value for each component.
- msg (str) – Accompanying diagnostic message, e.g. warning.